Pages

Tuesday, July 26, 2011

Model Manager Guru - Tips and Tricks

Anyone who has used the ERwin Model Manager in the past decade has probably spoken to Matt over in the support team. I know that he has saved my bacon on quite a few occasions and is probably the number one resource for all things "Mart-related". Well, it turns out that he has been blogging on the CA Community pages and I wanted to promote some of his tips to all of you following this blog.

Matt's most recent post deals with a performance enhancement to the Model Manager in ERwin 8.1 and the recent ERwin 7.3.11 release. Basically, by enabling...

ERWIN_INC_ORACLE_FETCH_BUFFER = true

...there is a significant improvement of performance on the Model Manager data retrieval (about 1.5 times) when using Oracle or Sybase as the repository server. This is yet another reason to upgrade to 8.1. Be sure to read my previous post for more 8.1 features.

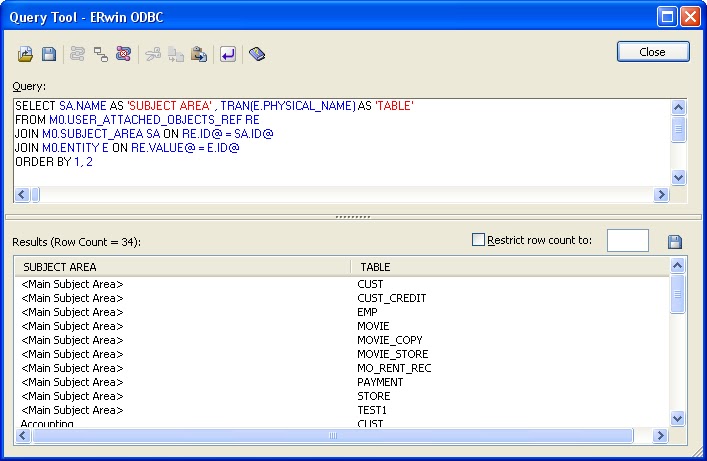
In this useful post Matt outlines a query that can be run against the Model Manager that will return all the model names as well as their target servers. For anyone that ever wanting a full report of the models and target servers without having to run individual reports, this is going to be a real time saver. The query is for SQL Server but can easily be modified for Oracle, as well.

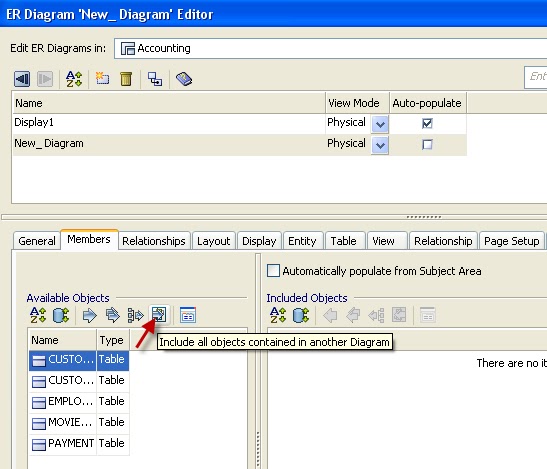
This technical document is a great resource for specific techniques that will greatly improve your Model Manager workflow. Nearly all the techniques outlined are at the user (ERwin client) level. So if you are not making any headway with tweaking your server settings (or getting your team to roll out an upgrade) you can probably achieve huge performance improvements simply by implementing a few best practices and process changes.

The techniques described, include auto filtering all object types (like all graphics) with a single option change, within the action log, itself. This is a pain point that users are often unaware has such a simple solution.

Also, the technique of saving files offline if there are extensive changes to be made is my personal process and a suggestion I make to anyone who asks for my performance enhancement suggestions. By saving files offline, you bypass such issues of:

- Losing changes due to network failure.
- Performance bottlenecks when everyone attempts to save their files simultaneously (lunch, end of day).
- Prevents the creation of many unwanted version due to repeated incremental saves.

Little process changes can have big impact on your time to project's bottom line.

A few years back, Matt also published this article which outlines Model Manager tuning suggestions. This article is also part of the Bookshelf that is included as part of your ERwin installation.

Lastly, since we are on the topic of improving the model manager performance, I'd like to suggest an index of my own. This one has been floating around for some time (I worked on it back when I was in CA Support). It is very simple and in my experience it has improved my Model Manager performance 20 fold. I recently worked with a client that had an identical performance boost so I think I will post it, again. Worst case scenario, you will have 0% improvement in performance enhancement and you can simply drop the index, if that is the case. The index is as follows:

-----Oracle Script---------
CREATE INDEX XAK3_MASTVERS ON m7object
 (
   MASTERID ASC,
   STARTVERSION ASC
 )
 LOGGING
 TABLESPACE ; -- Replace with the name of your Data Tablespace (e.g. MMADMIN).
---------End Oracle Script 

------Sql Server Script------

 CREATE INDEX XAK3_MASTVERS ON m7object
 (
        MASTERID              ASC,
        STARTVERSION          ASC
 )
 Go
 ----End Sql Server Script---------

Make sure to subscribe to Matt's blog and to check out CA's weekly Tuesday Tips for more insight from the CA technical community. 

Thursday, July 7, 2011

What's New In ERwin R8.1

So ERwin 8.1 is now available for download. What are the new features and what considerations are their with the upgrade.

Firstly, the above linked download 8.1 release does not include a Crystal Reports installation component. So if this is your initial install, be sure to install the 8.0 release with Crystal reports and then run the upgrade using the 8.1 install (it will automatically run as an upgrade). Of course, if you already have any ERwin 8.0 version installed, you simply execute the latest install package (either from a CD or the downloaded exe).

After your ERwin upgrade you will need to connect to your Model Mart to upgrade that to the latest version, as well. This takes only a few moments as the upgrade to the Mart is minimal. Have your Mart administrator upgrade their ERwin version to 8.1. Then have them navigate to the File | Mart | Initialize Mart... (don't worry, you will only be upgrading).

The admin will be prompted to connect as the same user that created the mart. After connecting, the initialization screen will only have an option for UPGRADE. Select Upgrade to complete the process.

Now, let's move on to the new features:

Fit to page printing

This may be the most demanded fix in the release. It simply allows the user to automatically fit the design into a single page, no matter the paper size. This feature is invoked through the actual Print editor.


Multiple diagram pictures

Personally, perhaps my most desired feature is the ability of generating multiple diagram picture reports at once. This was limited in the R8 release. This is most readily noticeable from the Tools | Diagram Picture | Generate Diagram Pictures menu item. Once the editor is invoked, you can easily select which diagrams in the current model you would like to generate images for and to which folder to publish them.


Lasso selection tool

The lasso selection tool works differently now, in that you will first lasso the objects that you would like to zoom in to (regardless of current magnification) and then click the Zoom to Fit Selection button in the Zoom Toolbar.

This is also available as an option from the View | Zoom menu items.

Preserve diagram layout enhancements

This is another nice fix. If you ever tried to copy and paste your design from one diagram to another (or between models) you noticed that the coordinates of the objects were lost. Now, they are preserved by default. This is going to save you a lot of time, laying out your design.

Similarly, when you derive a diagram based on an existing diagram, your layout will also be preserved.


Layout in Place

One of the great features of the ERwin r8 release is the ability to select only a subset of all the diagram objects and lay them out to one of the default layouts. This selective layout is a great time saver but in the 8.0 release the selected objects would move to a default location on the screen and would need to be moved again. This required extra work to achieve the desired result.

With r8.1 the layout now occurs within the context of the selected area so there is no need to move the objects again. This feature is the default and is automatically enabled. But it can be disabled from the Diagram | Layout menu items.


Copy objects enhancements


Another copy enhancement is that objects copied between from one diagram to another (in the same model) will simply create the drawing object with the preserved coordinates. You will no longer get duplicate tables, for example, if the tables already exist in the model.

ODBC Table Changes


The last topic I'll cover in this post is the addition of a new table to the ERwin ODBC client, DIAGRAM. If you have played with the ODBC reporting, previously, you may have noted the CURRENT_DIAGRAM table. Querying this table allowed the creation of a graphical report of the current diagram. With the additional support for multiple diagrams the DIAGRAM table was added to allow ODBC reporting against multiple graphical reports.

For much more information on this functionality, sign up for my Advanced ODBC Erwin Reporting Webinar.

Do you think these changes will help you with your modeling endeavors? Feel free to leave your comments and questions.

Tuesday, May 24, 2011

Crystal Reports For Data Model Reporting

In my previous post I described how you can create a Subject Area report using the CA ERwin software's ODBC client. Now let's look at how we can use the same query along with Crystal Reports 

To start, let's launch Crystal Reports. You can run Crystal Reports from the Programs folder for Crystal Reports. But running a report against the ERwin metadata requires that ERwin is running simultaneously, so let's start ERwin, open a model and then launch Crystal Reports developer from the ERwin Tools menu:

Once Crystal Reports launches, there are quite a few options as far as editing templates or even using some of the bundled reports in the ERwin install as a starting point. But we are simply going to create a File | New | Blank Report so that we are starting from scratch.

When you are presented with the Database Expert dialog expand the ERwin_r8_Current node under My Connections. In this node you will see the option to navigate through the ERwin metadata schemas (learn more) but for this exercise, we will be selecting the option to Add Command.


Click the chevron to move the selection to the right and you will be prompted to Add Command to Report. Select the final version of the Subject Area report from my previous blog post and paste it into this editor.

Then click OK. The Command is always created with the generic name of Command (or Command_n for all subsequent commands). This is not a very useful name so select the Command and click F2 so that we can rename it to SubjectAreasReport.

Click OK in this editor as well. This will finally take us to the design view for a new report. Note the Field Explorer to the right of the screen. If you mouse over it, it will expand and you can navigate the available fields. Expand the Database Fields node and the SubjectAreasReport sub-node. All the results from our SQL query are conveniently available, here.

Now, we can start to drag and drop the fields right into the report. However, for presentation purposes, let's create some groups. We do this using the Insert | Group option from the main menu. When presented with the Insert Group editor select SUBJECT AREA from the ...grouped by: option list. Note that you can also change the result order but we will accept ascending.


Do this twice more. For Table and Column, as well. When you are done, the results will look like:

I also indented the headings to gussy up the results.
Now, let's see what the data actually looks like. Use the View | Print Preview option.
Let's add the properties at the attribute level, now.We do this by simply dragging the remaining Database Fields from the Field Explorer into the Design view tab. Make sure that you drag them into the Details row under Group Header #3. When finished, they look like this:

Let's preview our data one more time, using View | Preview.
There is much more we can do as far as creating header and footer information and we can even query the model information to populate these. We can also create color schemes and embed images and web links. But we will stop at this point and leave some of these topics for future discussion.

Be sure to check out our recorded webinar that introduces the topic of using ERwin and Crystal Reports, as well. That may be a good primer before moving to the steps outlined in this post.

Tuesday, April 19, 2011

Building Your First ERwin ODBC Query

So I had to build a Crystal Report that included the Subject Areas, Tables, Columns and some Column Properties. This had to be a reusable report. I thought I would bring you in on the process in the hopes it might shed some light on some of your efforts.

Firstly, I needed some documentation and I needed a sandbox to play with the ERwin metadata. For my resources, I opened a model of the ERwin ODBC schema objects which is available at...

C:\Program Files\CA\ERwin Data Modeler r8\BackupFiles\Samples\ERwin Relational Metamodel.erwin

My other resources were the documentation of the Metadata and the ODBC documentation, both available at...

C:\Program Files\CA\ERwin Data Modeler r8\Doc\

So next, I needed a place to experiment with some queries. ERwin has a decent querying tool built right into it, available from the Tools | Query Tools.

I always develop in the context of a small model with a familiar design to minimize issues that may arise from the volume or complexity of the data. So I used the trusty EMovies model.

Next, knowing what I already know about the ERwin metadata, I decided the Subject Area was the best point to start. Subject Areas contain references to the included Entities and that would be a good way to structure my report.

If you are following along, you can begin with a very simple query...

SELECT SA.NAME AS 'SUBJECT AREA'
FROM
M0.SUBJECT_AREA SA 


So that part is simple enough and pretty intuitive. There is an actual table called SUBJECT_AREA that contains the Subject Area information. In this case we are only requesting the actual name of the subject area.

In the same schema, I also found a table with the name of ENTITY which contains all of the entity information, including the table names that I was looking for..

The next step was a little trickier. I was looking for a place where the references between the Entities and the Subject Areas were maintained. As it turned out, the M0 schema also contained a table called USER_ATTACHED_OBJECTS_REF. This table has a pretty simple structure. It has an ID and a Value that is referenced to it. There can be multiple Values (tables and views) for an ID (the Subject Area identifier) so there was also a SEQUENCE_NUMBER value. So I built the query as follows

SELECT SA.NAME AS 'SUBJECT AREA' , E.PHYSICAL_NAME AS 'TABLE'
FROM M0.USER_ATTACHED_OBJECTS_REF RE
JOIN M0.SUBJECT_AREA SA ON RE.ID@ = SA.ID@
JOIN M0.ENTITY E ON RE.VALUE@ = E.ID@
ORDER BY 1, 2


There is a serious issue, here. Since my Physical Names are mapped from Logical, I am seeing the mapping rule rather than the explicit table name string. There is a convenient way to resolve this and that is to include the TRAN syntax on any value that is derived. 

Our modified query looks like:

SELECT SA.NAME AS 'SUBJECT AREA' , TRAN(E.PHYSICAL_NAME) AS 'TABLE'
FROM M0.USER_ATTACHED_OBJECTS_REF RE
JOIN M0.SUBJECT_AREA SA ON RE.ID@ = SA.ID@
JOIN M0.ENTITY E ON RE.VALUE@ = E.ID@
ORDER BY 1, 2

...and the results...
So let's look at the actual logic of the query. First, we are selecting the Subject Area Name and the Physical Name property of the Entities. We can't simply select them from the two source tables since there needs to be a method of cross referencing them. so the FROM clause is actually on the reference table, USER_ATTACHED_OBJECTS_REF and then we JOIN on the SUBJECT_AREA and ENTITY tables. The method of aligning these is through the ID value in the reference table and the VALUE values.

Now we have to similarly cross reference the entity and attribute information. This turns out to be even simpler since the ATTRIBUTE entries have an owner value and that value is the reference to the owning entity. This gives us the query...


SELECT SA.NAME AS 'SUBJECT AREA' , TRAN(E.PHYSICAL_NAME) AS 'TABLE', TRAN(A.PHYSICAL_NAME) AS 'COLUMN'
FROM M0.USER_ATTACHED_OBJECTS_REF RE
JOIN M0.SUBJECT_AREA SA ON RE.ID@ = SA.ID@
JOIN M0.ENTITY E ON RE.VALUE@ = E.ID@
JOIN M0.ATTRIBUTE A ON A.owner@ = E.ID@
ORDER BY 1, 2,3


Notice that we again use the TRAN() on the attribute's physical name so that the property is translated to the physical expansion. 
Let's add some more useful properties, such as the NULL option and attribute domain and datatype.

SELECT SA.NAME AS 'SUBJECT AREA' , TRAN(E.PHYSICAL_NAME) AS 'TABLE', TRAN(A.PHYSICAL_NAME) AS 'COLUMN',
TRAN(A.NULL_OPTION_TYPE) AS 'NULL OPTION', TRAN(A.PARENT_DOMAIN_REF) AS 'DOMAIN',
A.PHYSICAL_DATA_TYPE AS 'DATATYPE'
FROM M0.USER_ATTACHED_OBJECTS_REF RE
JOIN M0.SUBJECT_AREA SA ON RE.ID@ = SA.ID@
JOIN M0.ENTITY E ON RE.VALUE@ = E.ID@
JOIN M0.ATTRIBUTE A ON A.owner@ = E.ID@
ORDER BY 1, 2,3

Remember to use the TRAN() function when necessary. In this example, the NULL option and the parent domain are references and references in one case and Boolean values, in another and would not display nicely without the translation.

Now that we have generated this report, there are quite a few things that can be done. The result set can be published as a CSV file. Also, we can use this very query in Excel to generate this report in the future. Similarly, we can use the included Crystal Reports editor to generate a report (or multiple reports) with the same query. For more on using Crystal Reports to generate a report, read this other blog post.


Monday, March 28, 2011

Where are you... Used?

One of the key added features of the ERwin R8 is the Where Used feature. What this feature shows you (not surprisingly) is where the particular object... is used. Ok, so we got that out of the way. Let's take a look at where this is available and what opportunities it provides us.

With all the current buzz around data governance, the question becomes how to begin to define a true data dictionary. While there is yet to be any tool (or set of tools) that can handle all that is required to define and maintain a true enterprise level data dictionary, the reality is that the data modeling tools that your organization already owns can provide some key features.

You can define your data systems using the reverse engineering features. You can create impose naming and datatype standards. You can define user defined metadata to assign tasks and responsibilities to separate systems and objects. You can maintain design history and plan the impact analysis of system changes. You can identify common metadata across many systems and link models to define relationships in your data. You can create reusable domains. You can create templates with all these standards in place so that new systems inherit them by default. This would also allow for central reporting on all of these features. You can even export your metadata information to other MDM, BI, and ETL tools to save time and ensure your standards.

But a key necessity to any of these implementations would be the ability of seeing exactly where a particular object is used in the design. Here are a few examples:

In this first example, we look at the table editor. Scroll to the right and note the Where Used tab.


The results listed show us a full list of the objects that relate to our table. This can include relationships and diagrams in which the tables exist. Perhaps the most useful usage is to validate that the table exists in the appropriate subject areas.

Another nice feature is that the editor for that particular object can be invoked, simply by selecting the object from the list and clicking on the button "Edit the Selected Object". This is valid, regardless of the object type. So a subject area will open a subject area editor while a relationship will open the object in the relationship editor. This allows for much faster navigation and editing of the model.

Let's take a look at a different property. In this case, we look at one of the new ERwin features; annotations.


Firstly, notice the similar editor and layout. This consistency in layout and editor features in the new version makes using these features easier to learn since the behavior is the same, across the board. Once again, we can quickly identify that we have assigned the annotation to all the diagrams on which they are needed.

Here is an even more powerful usage, default values.


In the above example, we can quickly identify that the default is correctly assigned to a column. A nearly identical process would be used to identify that validation rules are assigned to the correct columns and tables.


The ability to validate these properties are all key to any data governance initiative. But, perhaps, none is more useful than tracking domain to column assignment.


In the screenshot above, we have used the filter field in our domain editor to filter the available domains down to only the "address" related domains. Now, we can conveniently click on any of the domains (in this case, address_2) and by accessing the Where Used tab, we can quickly check to see that the domain is correctly assigned to the columns on which it should be.

So would there be a convenient way to run a report across all of the User Defined domains in the model into an Excel spreadsheet that included the table and column specifications for each domain. Actually, there is, the catch is that you would have to do a little coding using the ERwin API to do so.

The good news is that I have built such a project file. To request a copy, feel free to E-mail Me.


Thursday, January 27, 2011

Model Lineage in ERwin Data Modeler

A fundamental issue with documenting and defining our data warehouse is to have a true documentation of the relationships between the different models within our design. There are powerful dimensional modeling documentation tools within CA ERwin Data Modeler. Aside from allowing users to document data sources, there is the ability to define linked models. These linkages can occur when a model is derived from another or explicitly linking models or adding models as sources.

What I have often heard, however, is that it would be nice to be able to see a report of all the related models. Well, you can. The caveat is that you need to be storing the models in the Model Manager. If you are, then this is simply a case of reporting on the objects. Here is a SQL Server query that generates the report:

SELECT oLib.ObjectName                   "Library",
       oChild.ObjectName                 "Derived Model",
       opdrv1.StringValue                "Source Model",
       CASE CHARINDEX ('?',opdrv.StringValue)
           WHEN  0 THEN opdrv.StringValue
           ELSE  SUBSTRING(opdrv.StringValue,0,CHARINDEX ('?',opdrv.StringValue))
       END
                "Source Model Path"
FROM   m7Object              obj
        INNER JOIN m7Library             oLib
            ON     obj.ContextId              =  oLib.ObjectId
        INNER JOIN m7Library             oChild
            ON     obj.ObjectId               =  oChild.ObjectId
        INNER JOIN m7Object              odrv
            ON     obj.ObjectId               =  odrv.ContextId
            AND    odrv.ClassId              =  1075839045
        LEFT OUTER JOIN m7ObjectProperty      opdrv
            ON     odrv.ObjectId              =  opdrv.ObjectId
            AND    opdrv.PropertyId          =  1075849184      
        LEFT OUTER JOIN m7ObjectProperty      opdrv1
            ON     odrv.ObjectId              =  opdrv1.ObjectId
            AND    opdrv1.PropertyId         =  1073742126      
ORDER BY oLib.ObjectName,
         obj.ObjectId
        
This query's results will look something like this:
 
OK, the trickiest part of the query is the CASE clause and I did not even need it. I used it since my initial query included the unique Id and version of the model in the Model Manager, such as...
ModelMart://MM73/source test/Source?lid={26105FEB-73E6-4C97-8693-307BD1BD5193}+00000000&mid={B3FEAD4E-61E3-420F-A99A-640507B1FC94}+00000000&ver=1

While this is necessary for the Model Manager, it is probably more than we need to see for our report. So, I needed some way of stripping off the '?' character and everything after it.

By the way, Oracle offers a very similar syntax using INSTR and SUBSTR. So logic similar to 


SUBSTR (StringValue,0,INSTR(StringValue,'?')) 

would give a similar result for an Oracle repository.

Next Steps:

Is there a way of generating a report that can show you related objects on an object by object basis? The answer is yes... but it would be very difficult. The problem is that there is an array that contains the Long Id (a large string, in hex) that contains a list of each related object and there is another array that contains the mapped objects. With very complex queries or using the API it would be possible to open two models and start loading the items on either side. I, personally, think this is a waste of time. Once I know what models are related I can open them in ERwin and use the Sync with Model Source editor along with the built in reporting tools to generate an Excel or HTML report of the linked objects. Let ERwin do the heavy lifting.

My personal next action step is to use the API to build a relational model that shows the relationships between the linked models. The models will be defined as Entities. Relationship lines will indicate related models. The path to each source and target model location will be held in an Entity UDP. 

I think that would be a more useful way to see the relationships between the models. Don't you? Tell me what you think.