
In my previous post I described how you can create a Subject Area report using the CA ERwin software's ODBC client. Now let's look at how we can use the same query along with Crystal Reports
To start, let's launch Crystal Reports. You can run Crystal Reports from the Programs folder for Crystal Reports. But running a report against the ERwin metadata requires that ERwin is running simultaneously, so let's start ERwin, open a model and then launch Crystal Reports developer from the ERwin Tools menu:
 Once Crystal Reports launches, there are quite a few options as far as editing templates or even using some of the bundled reports in the ERwin install as a starting point. But we are simply going to create a File | New | Blank Report so that we are starting from scratch.
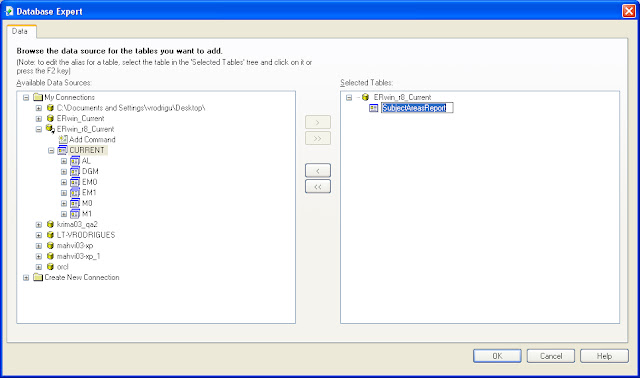
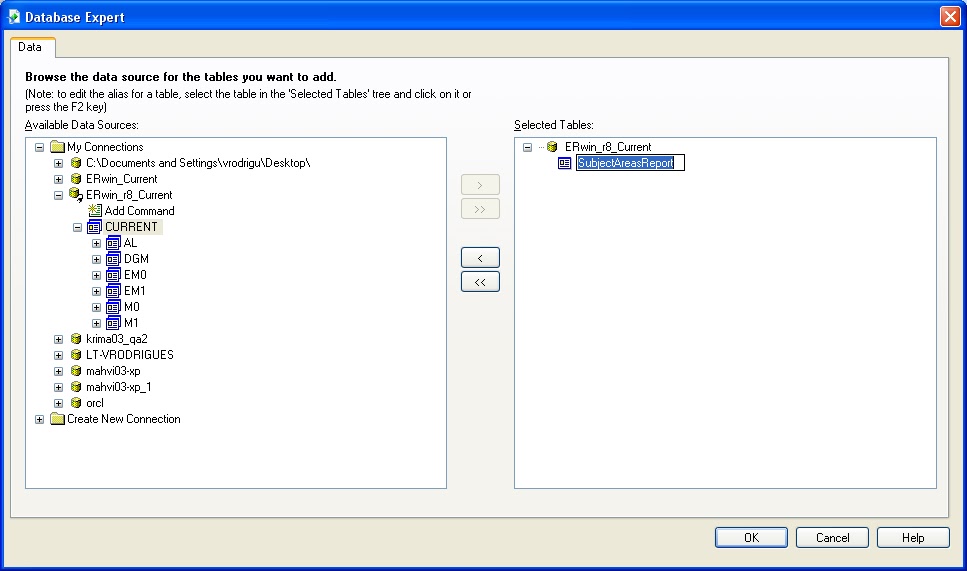
When you are presented with the Database Expert dialog expand the ERwin_r8_Current node under My Connections. In this node you will see the option to navigate through the ERwin metadata schemas (learn more) but for this exercise, we will be selecting the option to Add Command.

Click the chevron to move the selection to the right and you will be prompted to Add Command to Report. Select the final version of the Subject Area report from my previous blog post and paste it into this editor.

Then click OK. The Command is always created with the generic name of Command (or Command_n for all subsequent commands). This is not a very useful name so select the Command and click F2 so that we can rename it to SubjectAreasReport.
Click OK in this editor as well. This will finally take us to the design view for a new report. Note the Field Explorer to the right of the screen. If you mouse over it, it will expand and you can navigate the available fields. Expand the Database Fields node and the SubjectAreasReport sub-node. All the results from our SQL query are conveniently available, here.

Now, we can start to drag and drop the fields right into the report. However, for presentation purposes, let's create some groups. We do this using the Insert | Group option from the main menu. When presented with the Insert Group editor select SUBJECT AREA from the ...grouped by: option list. Note that you can also change the result order but we will accept ascending.

Do this twice more. For Table and Column, as well. When you are done, the results will look like:

I also indented the headings to gussy up the results.
 Now, let's see what the data actually looks like. Use the View | Print Preview option.
 Let's add the properties at the attribute level, now.We do this by simply dragging the remaining Database Fields from the Field Explorer into the Design view tab. Make sure that you drag them into the Details row under Group Header #3. When finished, they look like this:

Let's preview our data one more time, using View | Preview.
 There is much more we can do as far as creating header and footer information and we can even query the model information to populate these. We can also create color schemes and embed images and web links. But we will stop at this point and leave some of these topics for future discussion.
Be sure to check out our recorded webinar that introduces the topic of using ERwin and Crystal Reports, as well. That may be a good primer before moving to the steps outlined in this post.
To start, let's launch Crystal Reports. You can run Crystal Reports from the Programs folder for Crystal Reports. But running a report against the ERwin metadata requires that ERwin is running simultaneously, so let's start ERwin, open a model and then launch Crystal Reports developer from the ERwin Tools menu:

When you are presented with the Database Expert dialog expand the ERwin_r8_Current node under My Connections. In this node you will see the option to navigate through the ERwin metadata schemas (learn more) but for this exercise, we will be selecting the option to Add Command.

Click the chevron to move the selection to the right and you will be prompted to Add Command to Report. Select the final version of the Subject Area report from my previous blog post and paste it into this editor.

Then click OK. The Command is always created with the generic name of Command (or Command_n for all subsequent commands). This is not a very useful name so select the Command and click F2 so that we can rename it to SubjectAreasReport.
Click OK in this editor as well. This will finally take us to the design view for a new report. Note the Field Explorer to the right of the screen. If you mouse over it, it will expand and you can navigate the available fields. Expand the Database Fields node and the SubjectAreasReport sub-node. All the results from our SQL query are conveniently available, here.

Now, we can start to drag and drop the fields right into the report. However, for presentation purposes, let's create some groups. We do this using the Insert | Group option from the main menu. When presented with the Insert Group editor select SUBJECT AREA from the ...grouped by: option list. Note that you can also change the result order but we will accept ascending.

Do this twice more. For Table and Column, as well. When you are done, the results will look like:

I also indented the headings to gussy up the results.


Let's preview our data one more time, using View | Preview.

Be sure to check out our recorded webinar that introduces the topic of using ERwin and Crystal Reports, as well. That may be a good primer before moving to the steps outlined in this post.