Pages

Tuesday, May 24, 2011

Crystal Reports For Data Model Reporting

In my previous post I described how you can create a Subject Area report using the CA ERwin software's ODBC client. Now let's look at how we can use the same query along with Crystal Reports 

To start, let's launch Crystal Reports. You can run Crystal Reports from the Programs folder for Crystal Reports. But running a report against the ERwin metadata requires that ERwin is running simultaneously, so let's start ERwin, open a model and then launch Crystal Reports developer from the ERwin Tools menu:

Once Crystal Reports launches, there are quite a few options as far as editing templates or even using some of the bundled reports in the ERwin install as a starting point. But we are simply going to create a File | New | Blank Report so that we are starting from scratch.

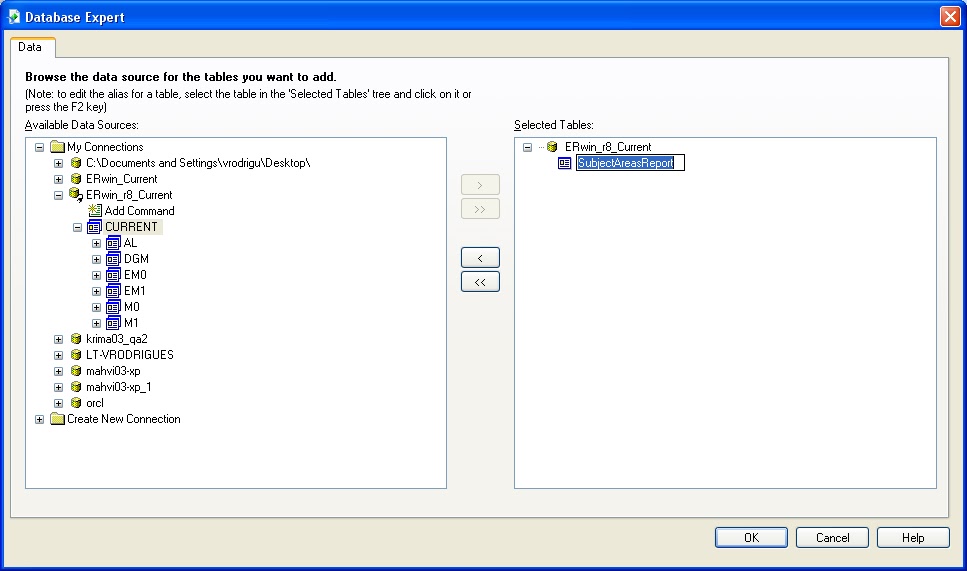
When you are presented with the Database Expert dialog expand the ERwin_r8_Current node under My Connections. In this node you will see the option to navigate through the ERwin metadata schemas (learn more) but for this exercise, we will be selecting the option to Add Command.


Click the chevron to move the selection to the right and you will be prompted to Add Command to Report. Select the final version of the Subject Area report from my previous blog post and paste it into this editor.

Then click OK. The Command is always created with the generic name of Command (or Command_n for all subsequent commands). This is not a very useful name so select the Command and click F2 so that we can rename it to SubjectAreasReport.
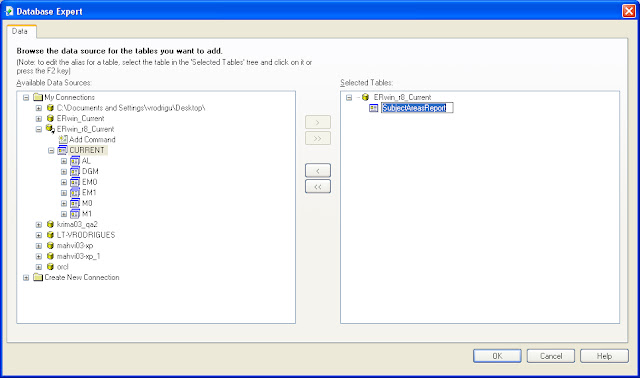
Click OK in this editor as well. This will finally take us to the design view for a new report. Note the Field Explorer to the right of the screen. If you mouse over it, it will expand and you can navigate the available fields. Expand the Database Fields node and the SubjectAreasReport sub-node. All the results from our SQL query are conveniently available, here.

Now, we can start to drag and drop the fields right into the report. However, for presentation purposes, let's create some groups. We do this using the Insert | Group option from the main menu. When presented with the Insert Group editor select SUBJECT AREA from the ...grouped by: option list. Note that you can also change the result order but we will accept ascending.


Do this twice more. For Table and Column, as well. When you are done, the results will look like:

I also indented the headings to gussy up the results.
Now, let's see what the data actually looks like. Use the View | Print Preview option.
Let's add the properties at the attribute level, now.We do this by simply dragging the remaining Database Fields from the Field Explorer into the Design view tab. Make sure that you drag them into the Details row under Group Header #3. When finished, they look like this:

Let's preview our data one more time, using View | Preview.
There is much more we can do as far as creating header and footer information and we can even query the model information to populate these. We can also create color schemes and embed images and web links. But we will stop at this point and leave some of these topics for future discussion.

Be sure to check out our recorded webinar that introduces the topic of using ERwin and Crystal Reports, as well. That may be a good primer before moving to the steps outlined in this post.

Tuesday, April 19, 2011

Building Your First ERwin ODBC Query

So I had to build a Crystal Report that included the Subject Areas, Tables, Columns and some Column Properties. This had to be a reusable report. I thought I would bring you in on the process in the hopes it might shed some light on some of your efforts.

Firstly, I needed some documentation and I needed a sandbox to play with the ERwin metadata. For my resources, I opened a model of the ERwin ODBC schema objects which is available at...

C:\Program Files\CA\ERwin Data Modeler r8\BackupFiles\Samples\ERwin Relational Metamodel.erwin

My other resources were the documentation of the Metadata and the ODBC documentation, both available at...

C:\Program Files\CA\ERwin Data Modeler r8\Doc\

So next, I needed a place to experiment with some queries. ERwin has a decent querying tool built right into it, available from the Tools | Query Tools.

I always develop in the context of a small model with a familiar design to minimize issues that may arise from the volume or complexity of the data. So I used the trusty EMovies model.

Next, knowing what I already know about the ERwin metadata, I decided the Subject Area was the best point to start. Subject Areas contain references to the included Entities and that would be a good way to structure my report.

If you are following along, you can begin with a very simple query...

SELECT SA.NAME AS 'SUBJECT AREA'
FROM
M0.SUBJECT_AREA SA 


So that part is simple enough and pretty intuitive. There is an actual table called SUBJECT_AREA that contains the Subject Area information. In this case we are only requesting the actual name of the subject area.

In the same schema, I also found a table with the name of ENTITY which contains all of the entity information, including the table names that I was looking for..

The next step was a little trickier. I was looking for a place where the references between the Entities and the Subject Areas were maintained. As it turned out, the M0 schema also contained a table called USER_ATTACHED_OBJECTS_REF. This table has a pretty simple structure. It has an ID and a Value that is referenced to it. There can be multiple Values (tables and views) for an ID (the Subject Area identifier) so there was also a SEQUENCE_NUMBER value. So I built the query as follows

SELECT SA.NAME AS 'SUBJECT AREA' , E.PHYSICAL_NAME AS 'TABLE'
FROM M0.USER_ATTACHED_OBJECTS_REF RE
JOIN M0.SUBJECT_AREA SA ON RE.ID@ = SA.ID@
JOIN M0.ENTITY E ON RE.VALUE@ = E.ID@
ORDER BY 1, 2


There is a serious issue, here. Since my Physical Names are mapped from Logical, I am seeing the mapping rule rather than the explicit table name string. There is a convenient way to resolve this and that is to include the TRAN syntax on any value that is derived. 

Our modified query looks like:

SELECT SA.NAME AS 'SUBJECT AREA' , TRAN(E.PHYSICAL_NAME) AS 'TABLE'
FROM M0.USER_ATTACHED_OBJECTS_REF RE
JOIN M0.SUBJECT_AREA SA ON RE.ID@ = SA.ID@
JOIN M0.ENTITY E ON RE.VALUE@ = E.ID@
ORDER BY 1, 2

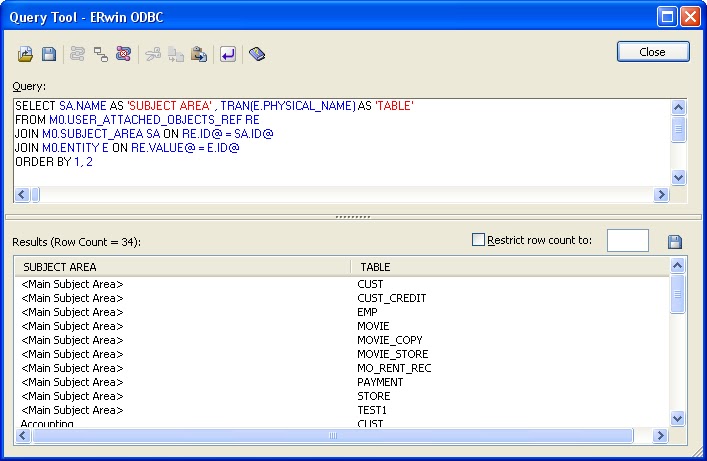
...and the results...
So let's look at the actual logic of the query. First, we are selecting the Subject Area Name and the Physical Name property of the Entities. We can't simply select them from the two source tables since there needs to be a method of cross referencing them. so the FROM clause is actually on the reference table, USER_ATTACHED_OBJECTS_REF and then we JOIN on the SUBJECT_AREA and ENTITY tables. The method of aligning these is through the ID value in the reference table and the VALUE values.

Now we have to similarly cross reference the entity and attribute information. This turns out to be even simpler since the ATTRIBUTE entries have an owner value and that value is the reference to the owning entity. This gives us the query...


SELECT SA.NAME AS 'SUBJECT AREA' , TRAN(E.PHYSICAL_NAME) AS 'TABLE', TRAN(A.PHYSICAL_NAME) AS 'COLUMN'
FROM M0.USER_ATTACHED_OBJECTS_REF RE
JOIN M0.SUBJECT_AREA SA ON RE.ID@ = SA.ID@
JOIN M0.ENTITY E ON RE.VALUE@ = E.ID@
JOIN M0.ATTRIBUTE A ON A.owner@ = E.ID@
ORDER BY 1, 2,3


Notice that we again use the TRAN() on the attribute's physical name so that the property is translated to the physical expansion. 
Let's add some more useful properties, such as the NULL option and attribute domain and datatype.

SELECT SA.NAME AS 'SUBJECT AREA' , TRAN(E.PHYSICAL_NAME) AS 'TABLE', TRAN(A.PHYSICAL_NAME) AS 'COLUMN',
TRAN(A.NULL_OPTION_TYPE) AS 'NULL OPTION', TRAN(A.PARENT_DOMAIN_REF) AS 'DOMAIN',
A.PHYSICAL_DATA_TYPE AS 'DATATYPE'
FROM M0.USER_ATTACHED_OBJECTS_REF RE
JOIN M0.SUBJECT_AREA SA ON RE.ID@ = SA.ID@
JOIN M0.ENTITY E ON RE.VALUE@ = E.ID@
JOIN M0.ATTRIBUTE A ON A.owner@ = E.ID@
ORDER BY 1, 2,3

Remember to use the TRAN() function when necessary. In this example, the NULL option and the parent domain are references and references in one case and Boolean values, in another and would not display nicely without the translation.

Now that we have generated this report, there are quite a few things that can be done. The result set can be published as a CSV file. Also, we can use this very query in Excel to generate this report in the future. Similarly, we can use the included Crystal Reports editor to generate a report (or multiple reports) with the same query. For more on using Crystal Reports to generate a report, read this other blog post.


Monday, March 28, 2011

Where are you... Used?

One of the key added features of the ERwin R8 is the Where Used feature. What this feature shows you (not surprisingly) is where the particular object... is used. Ok, so we got that out of the way. Let's take a look at where this is available and what opportunities it provides us.

With all the current buzz around data governance, the question becomes how to begin to define a true data dictionary. While there is yet to be any tool (or set of tools) that can handle all that is required to define and maintain a true enterprise level data dictionary, the reality is that the data modeling tools that your organization already owns can provide some key features.

You can define your data systems using the reverse engineering features. You can create impose naming and datatype standards. You can define user defined metadata to assign tasks and responsibilities to separate systems and objects. You can maintain design history and plan the impact analysis of system changes. You can identify common metadata across many systems and link models to define relationships in your data. You can create reusable domains. You can create templates with all these standards in place so that new systems inherit them by default. This would also allow for central reporting on all of these features. You can even export your metadata information to other MDM, BI, and ETL tools to save time and ensure your standards.

But a key necessity to any of these implementations would be the ability of seeing exactly where a particular object is used in the design. Here are a few examples:

In this first example, we look at the table editor. Scroll to the right and note the Where Used tab.


The results listed show us a full list of the objects that relate to our table. This can include relationships and diagrams in which the tables exist. Perhaps the most useful usage is to validate that the table exists in the appropriate subject areas.

Another nice feature is that the editor for that particular object can be invoked, simply by selecting the object from the list and clicking on the button "Edit the Selected Object". This is valid, regardless of the object type. So a subject area will open a subject area editor while a relationship will open the object in the relationship editor. This allows for much faster navigation and editing of the model.

Let's take a look at a different property. In this case, we look at one of the new ERwin features; annotations.


Firstly, notice the similar editor and layout. This consistency in layout and editor features in the new version makes using these features easier to learn since the behavior is the same, across the board. Once again, we can quickly identify that we have assigned the annotation to all the diagrams on which they are needed.

Here is an even more powerful usage, default values.


In the above example, we can quickly identify that the default is correctly assigned to a column. A nearly identical process would be used to identify that validation rules are assigned to the correct columns and tables.


The ability to validate these properties are all key to any data governance initiative. But, perhaps, none is more useful than tracking domain to column assignment.


In the screenshot above, we have used the filter field in our domain editor to filter the available domains down to only the "address" related domains. Now, we can conveniently click on any of the domains (in this case, address_2) and by accessing the Where Used tab, we can quickly check to see that the domain is correctly assigned to the columns on which it should be.

So would there be a convenient way to run a report across all of the User Defined domains in the model into an Excel spreadsheet that included the table and column specifications for each domain. Actually, there is, the catch is that you would have to do a little coding using the ERwin API to do so.

The good news is that I have built such a project file. To request a copy, feel free to E-mail Me.


Thursday, January 27, 2011

Model Lineage in ERwin Data Modeler

A fundamental issue with documenting and defining our data warehouse is to have a true documentation of the relationships between the different models within our design. There are powerful dimensional modeling documentation tools within CA ERwin Data Modeler. Aside from allowing users to document data sources, there is the ability to define linked models. These linkages can occur when a model is derived from another or explicitly linking models or adding models as sources.

What I have often heard, however, is that it would be nice to be able to see a report of all the related models. Well, you can. The caveat is that you need to be storing the models in the Model Manager. If you are, then this is simply a case of reporting on the objects. Here is a SQL Server query that generates the report:

SELECT oLib.ObjectName                   "Library",
       oChild.ObjectName                 "Derived Model",
       opdrv1.StringValue                "Source Model",
       CASE CHARINDEX ('?',opdrv.StringValue)
           WHEN  0 THEN opdrv.StringValue
           ELSE  SUBSTRING(opdrv.StringValue,0,CHARINDEX ('?',opdrv.StringValue))
       END
                "Source Model Path"
FROM   m7Object              obj
        INNER JOIN m7Library             oLib
            ON     obj.ContextId              =  oLib.ObjectId
        INNER JOIN m7Library             oChild
            ON     obj.ObjectId               =  oChild.ObjectId
        INNER JOIN m7Object              odrv
            ON     obj.ObjectId               =  odrv.ContextId
            AND    odrv.ClassId              =  1075839045
        LEFT OUTER JOIN m7ObjectProperty      opdrv
            ON     odrv.ObjectId              =  opdrv.ObjectId
            AND    opdrv.PropertyId          =  1075849184      
        LEFT OUTER JOIN m7ObjectProperty      opdrv1
            ON     odrv.ObjectId              =  opdrv1.ObjectId
            AND    opdrv1.PropertyId         =  1073742126      
ORDER BY oLib.ObjectName,
         obj.ObjectId
        
This query's results will look something like this:
 
OK, the trickiest part of the query is the CASE clause and I did not even need it. I used it since my initial query included the unique Id and version of the model in the Model Manager, such as...
ModelMart://MM73/source test/Source?lid={26105FEB-73E6-4C97-8693-307BD1BD5193}+00000000&mid={B3FEAD4E-61E3-420F-A99A-640507B1FC94}+00000000&ver=1

While this is necessary for the Model Manager, it is probably more than we need to see for our report. So, I needed some way of stripping off the '?' character and everything after it.

By the way, Oracle offers a very similar syntax using INSTR and SUBSTR. So logic similar to 


SUBSTR (StringValue,0,INSTR(StringValue,'?')) 

would give a similar result for an Oracle repository.

Next Steps:

Is there a way of generating a report that can show you related objects on an object by object basis? The answer is yes... but it would be very difficult. The problem is that there is an array that contains the Long Id (a large string, in hex) that contains a list of each related object and there is another array that contains the mapped objects. With very complex queries or using the API it would be possible to open two models and start loading the items on either side. I, personally, think this is a waste of time. Once I know what models are related I can open them in ERwin and use the Sync with Model Source editor along with the built in reporting tools to generate an Excel or HTML report of the linked objects. Let ERwin do the heavy lifting.

My personal next action step is to use the API to build a relational model that shows the relationships between the linked models. The models will be defined as Entities. Relationship lines will indicate related models. The path to each source and target model location will be held in an Entity UDP. 

I think that would be a more useful way to see the relationships between the models. Don't you? Tell me what you think. 


Tuesday, December 21, 2010

From Spreadsheet to Data Model

Happy Holidays everybody.

In an ideal world, the physical model is derived from a logical model. The modeling team has done their due diligence and compiled all the business requirements and a consensus of naming standards, notations, and process definitions have already been agreed upon.

However, we do not live in an ideal world. The reality is that we often have to begin with the current physical environment. Any process of documenting and standardizing our design requires working backward from the current status to a more generalized one.

This often leads to the fact that there is a spreadsheet somewhere (there always is) that contains our documented logical attribute names and a data model that was reverse engineered from the database environment. How can we integrate the two?

What follows is a step by step process of integrating your logical names and your physical model using CA ERwin Data Modeler. You will need a Physical Model to start with and a spreadsheet with the documented attribute names.

1 - Reverse engineer (RE) your database as a Physical Only (PO) model and save it. If you already have a combined Logical/Physical model, you can use the Tools | Split model to derive a PO model. The RE can be against any supported database version (even ODBC) or a flat file containing the SQL statements to generate the objects.


2 - We will need to format the documentation of the column to logical names so that the logical names are in the first column of the spreadsheet and so that there is no header information. So the example documentation below...


...is reformatted into the format below...

Don't worry if you have duplicate column names. Even with duplicates, the mapping will work. There may be issues that will need to be manually corrected but I will save that discussion for the end.

3 - Save this Excel file as a CSV file, using the File | Save As... feature.

4 - In ERwin, in the Tools | Names | Model Naming Options select the Use File option and click Edit


This opens the Naming Standards Editor. We can manually build a glossary here but we will be importing, instead.

5 - Go to the Glossary tab and select the Import button. Notice that the expected File type in the File Selection editor is a CSV file. Select the CSV file from step 3. This will populate the glossary


6 - After building the glossary, be sure to save this glossary using the File | Save. This will create a NSM file. The NSM file is a proprietary ERwin file used in Name Mapping.

7 - Once you save the NSM, exit the editor. You will be back in the Model Naming Options editor in the ERwin software. Browse to the newly created NSM file.

8 - While still in the Model Naming Options editor, be sure to click on the Name Mapping tab and select the option to use the glossary for mapping your logical to physical attribute names. This step is essential and often overlooked.


9 - Click OK to save these changes.

10 - Use the Tools | Derive New Model and select your model type as Logical only model.


Notice that in the Naming Standards options, in this editor, that the NSM file attached to the current physical model is already selected. This is where an alternate NSM file could also be used, if necessary, in the future.

11 - Click Derive.

12 - If all goes correctly, we will be seeing our expanded Logical names in the new Logical model. Be sure to save this new Logical Only model version.

We're almost done. Now, let's derive the final combined model.

13 - In the current Model use the Tools | Derive New Model. Specify the Model Type to be Logical/Physical and make sure that the database version matches the original model (in case it does not) and click Derive.


The resulting Logical Physical model will allow you to toggle from the logical to the physical display and show the appropriate expansion or abbreviations based on the mappings.


Final notes and a caveat:

I am often asked if this works with foreign languages or special characters. The answer is yes. A user can use this technique even with foreign characters. Another frequent question is if the glossary can be refined, afterward, so that phrases can be replaced with individual word mappings. Again, the answer is yes. The nicest thing about the above outlined technique is that the final derived combined model is actively mapping based on the NSM glossary. The glossary can be modified and the model will update accordingly.

There is one caveat to this process and that is that you may often find that the same column (perhaps ID) can exist in many places but can have different expanded logical names (Department Identifier in the Department table and Employee Identifier in the Employee table, perhaps). This technique will not automatically be able to differentiate these and will map both instances of column to the same expansion. It would be pretty easy to identify the duplicates in the spreadsheet by sorting on the column names. These duplicates would need to be manually fixed in the model, by renaming these attributes in the in the logical model.

Thursday, October 21, 2010

Shortening the Distance from There to Here - The Benefits of Virtualization

A large corporation has a development team in India. An application developer in India needs to see the latest revisions to the data warehouse design in order to finalize a new web portal to the data warehouse. Unfortunately, the model that contains the design was not saved to the correct share drive before the US team members left for the night. The India team does not have direct access to the data warehouse so the project is delayed for another day.

A corporation has downsized and is now forced doing more with less. A newly reduced staff of technicians on the East Coast requires an expert data architect with Teradata experience. A perfect candidate exists within the corporation and recently has had their Los Angeles office closed.  Unfortunately, attempts to integrate the team member prove to be inefficient and add too many more steps from design to implementation and the company is unable to take advantage of their asset.

Due to a merger, two teams are attempting to merge their system processes. However, since team members are using different operating systems, they are not able to collaborate using the same software tools.

These are a few simple examples of situations that can be ameliorated by virtualizing infrastructure. As our enterprises become more and more geographically disparate and a 24 hour cycle becomes more commonplace, the question becomes how to best merge our processes and assets. Users implementing a repository based solution are ideal candidates for this type of solution.

Users of the CA ERwin/Model Manger suite get a dynamic and customizable data modeling tool with more robust features than any other similar product on the market. This solution includes a repository for model storage and global reporting. This repository allows for complex 3-way model merges and complex model lineage and history. The trade-off for this complexity, however, is performance.

Anyone using the Model Manager in a geographically diverse team has dealt with issues when attempting to merge models as team members remote to the repository server send data to the server, await verification of synchronized and diverse objects, save appropriate changes, and pass information back to the remote user for difference reconciliation. This back and forth traffic to these remote users can run into many bottlenecks.

Often times, these remote users are accessing the network via VPN or the data is passing through multiple subnets. Meanwhile, local network users may need to await these changes to save their own recent changes. This leads to a cascading effect of performance issues as the queue of users awaiting server access grows longer. Worse yet, this ever lengthening delay increases the likelihood of a network or server failure leading to potential data loss, as the current model changes are lost.

While it would be possible to fine tune every step along this complex network to improve the movement of data from one subnet to another, virtualization provides a more elegant solution. Furthermore, there are added benefits that virtualization provides.

In a virtualized environment, the server and virtual desktops would reside within a single physical server. Since the client and server components are both running locally, in relation to each other, users experience huge improvements in performance. There is a compounding effect as each model merge executes rapidly, minimizing the queue of demands on the network. Also, previous workarounds such as saving the files locally for future merge or scheduling explicit save times for your users can be avoided, giving a truer assessment of your project at any time.

But these are only some of the benefits. Any network will have to deal with inconsistent network performance and data loss. Frequently, as an application is attempting to access a database, packet delivery failure can occur at the database server level, via any bridge over the network or via the VPN connection. Failure at any point could lead to the failure of the software and data loss if the current model changes have not been saved.

By virtualizing the components, any network failure will no longer lead to data loss since any network failure will simply require the remote user to reconnect to the virtual environment to pick up right where they left off.

But wait, there’s more! Containing the entire infrastructure on a single physical server makes backup and restore for disaster recovery possible as a single step. Depending on the frequency of our backups, we can ensure that no more than a few minutes of work are lost.

Alternately, multiple users can have access to the same login at different times in the design phase. Let’s assume that we have a modeler during a data integration phase of our data management initiative. But another user will be the modeler during the data warehouse design phase of the process. By simply revoking one user’s network access to the image and replacing them with another, we can maintain our design flow with fewer licenses. Consultants working on one phase of a project can seamlessly be replaced with another group of users. This implementation would give the functionality of floating licenses.

Virtualization also helps as the data management initiative progresses. Upgrading our database, repository and client software can all be managed by a single administrator of a single device. No longer will many users be running multiple versions of the software using dissimilar operating systems.

Similarly, scaling upwards would simply require upgrading a single physical server or adding a second server on a shared subnet. No longer will multiple users in different offices need to add more RAM to their individual environments. Even a lightweight laptop on an unstable wi-fi connection in an airport can request massive processing on a remote server since the laptop behaves like a console. A user can quickly disconnect, go through security and reconnect to find their project exactly where they left off. There would no longer be any reason to have these physical files saved on remote PCs.

As the complexity of our data continues to grow unabated along with our ever-expanding enterprises in this flattened business world, virtualizing the infrastructure of these processes and containing them as independent and easily scaled appliances has more and more value. The need for our businesses to be more agile without significant new resources is more and more essential. In a world where we need to learn to do more with less, here is an opportunity to actually improve performance and scalability while simplifying our business process.

Thursday, September 9, 2010

Law & Order: DQ


I recently had to appear in court due to my failure to display my insurance information during a routine traffic stop.  I was not able to pay the fine online due to the nature of the violation.  As someone who thinks about data management and data quality on a daily basis, I had obviously done a bad job of correctly migrating my data (my insurance card) from one location to another (between my old and new wallet).  However, my later experience at the courthouse provided some interesting insight into the natural trend to allow our processes to degrade without review or reassessment.
I arrived almost an hour early to find a long line of fellow violators ahead of me .  After providing our violation information we were given numbers (mine was 29).  We then sat and waited for the proceedings to begin.  During this time, some of us discussed the events that led us to this moment in time. Some took responsibility for their actions while others claimed that they had been entrapped. .  Still others bragged that they had been given a slap on the wrist and had gotten away with far worse.  I guess this is the usual behavior of criminals when they congregate or at least that is what a lifetime of prison movies and television police procedurals had lead me to believe.
Eventually the judge arrived and the court session began.  I was shocked to discover that the judge immediately called a case which appeared to have a long history and involved negotiating payment schedules between two small business proprietors. This first case took about 20 minutes to hear.  It was followed by cases involving domestic abuse and public drunkenness.  Between these cases, the more minor violations were called.  Hours passed while I waited for my number to be called.  Once called, I quickly pled guilty and provided the necessary documentation, at which point I moved over to the payment line.  Once again, there was a single line at the payment counter.  Whether we were scheduling payments for thousands of dollars in fines, or renegotiating scheduled payments, or simply swiping our credit cards for a one time payment, we all waited on the same line and were given the same priority.  There were many angry tax payers on that line by the end of the long day.
We have all probably had a similar experience, whether it is in dealing with a government agency or the technical support staff of our cable provider.  In this case, it appeared that the process had been designed to fill in the day as best as possible.  To allow the employees to keep their day occupied from opening to closing.  But little attention has been paid to the experience of the client. 
Perhaps this had been a good model at some point, but clearly it had not been adapted to the changes to the market and to the conditions around them.
I bring up this anecdote because this is what occurs every day in our corporate lives.  We simply follow a pattern of behavior that was established when our business was significantly different.  By not reassessing what our business is today and looking at our process with new eyes, we run the risk of misuse and poor allocation of our resources.  Every day, we see processes that can be improved, yet we fail to act and make necessary changes.  There always seems to be a reason to delay, or a reason to wait for someone else to change the culture, but the reality is that everyone needs to participate in the process.
Which brings me back to the topic of data quality and governance; in this uncertain business climate it may be very hard to begin a new initiative or gain any traction in implementing a complex new data quality initiative but by identifying and fully leveraging our existing assets we may find that we can get most of the way there with relatively little added effort.
So what are some general strategies that anyone can implement to assess and improve their data quality initiatives?
First, identify your assets.  You are already managing data.  The problem is that you are doing it informally.  As part of a data management initiative you will need to structure your efforts.  An initial assessment will allow you to discover what you are doing right and wrong.  You’ll also be able to identify those thought leaders in your process who will be formally enabled to monitor progress and enforce your standards going forward.
Second, instill definitions and standards.  Definitions must exist at an enterprise level.  Without a strong foundation of metadata standards you cannot begin to properly align your efforts across the enterprise.  Imagine hiring a consulting team to build your data warehouse.  Upon arrival, the team finds a universal taxonomy across all data sources.  This will greatly enhance their efforts and minimize cost overruns for your project.  True universal and strongly-enforced metadata standards may not always be possible.  Corporations merge and there are cultural and linguistic barriers.  However, there must still be standardization within individual silos.  Once these are defined and enforced, mapping across them is far simpler.  Despite the complexity of this endeavor, the job is far more difficult for some external service provider with no relationship to your data.  Too often, the expectation is that a third-party will be left responsible for this crucial step, even though they have no relationship with the enterprise’s data.  This can lead to significant complications during data integration.  Just search Google for “Nike and i2” for a very public example of such a situation.
This leads us to our third point, which is possibly the most complex – Enable cultural change.  To implement a true change to our business process, you need to get everyone on board.  We all know how hard it can be. Some will see any change to your business process as a threat to their current status, while others will simply push back against a new process that may disturb their comfort with the current system.  Meanwhile, management may assume that any change of process will lead to a new department and expensive new resources down the line.  But there are simple changes that can be implemented that are unobtrusive and can reap significant rewards.
A case in point is the position of the Director of National Intelligence.  The 16 different US intelligence agencies are notoriously uncooperative.  This combative culture leads members of the different organization to be competitive and proprietary about data.  This silo mentality prevented the sharing of urgent information.  Following the September 11th attacks, a new office was defined for a Director of National Intelligence.  While there has been continuing push-back from the various agencies, and the position has been difficult to keep filled, there has nonetheless been a huge improvement in collaboration.  The primary reason for this was the creation of “A Space”, an online forum where roughly 1,000 intelligence analysts post, share and evaluate each other's data daily.  A CIA veteran Paul Pillar states in an interview with NPR earlier this year, "There is absolutely no question that the amount of collaboration is far more extensive than it ever was in the 38 years that I spent in the intelligence community."
This example makes the point that even the most entrenched cultures can change, if a collaborative space is created and maintained to allow the process to take shape.  Building and maintaining such a space will encourage participation.
We live in an age in which the market is ever changing.  Old business paradigms are shifting.  Businesses need to be able to move with agility.  Often times, a simple redesign of a current process can deliver a desirable result – with little added effort or cost.  It is the same with your data quality initiatives.  Take ownership of your data and reassess your current data management process and you may be surprised to find that you are closer to your goals than you think.